|
500
|
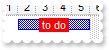
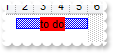
How can I change the foreground color of the HTML text or caption of the bar in the chart
with Gantt1 do
begin
	Columns.Add('Task');
	Chart.FirstVisibleDate := '1/1/2001';
	with Items do
	begin
		h := AddItem('Task 1');
		AddBar(h,'Task','1/2/2001','1/6/2001','K1',Null);
		ItemBar[h,'K1',EXGANTTLib_TLB.exBarCaption] := '<bgcolor=FF0000> to do </bgcolor>';
		ItemBar[h,'K1',EXGANTTLib_TLB.exBarForeColor] := OleVariant(16777215);
	end;
end
|
|
499
|
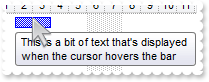
How can I assign a tooltip to a bar in the chart
with Gantt1 do
begin
	Columns.Add('Task');
	Chart.FirstVisibleDate := '1/1/2001';
	with Items do
	begin
		h := AddItem('Task 1');
		AddBar(h,'Task','1/2/2001','1/4/2001','K1',Null);
		ItemBar[h,'K1',EXGANTTLib_TLB.exBarToolTip] := 'This is a bit of text that''s displayed when the cursor hovers the bar';
	end;
end
|
|
498
|
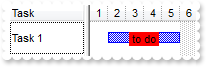
How can I vertically align the HTML text or caption of the bar in the chart
with Gantt1 do
begin
	Columns.Add('Task');
	Chart.FirstVisibleDate := '1/1/2001';
	with Items do
	begin
		h := AddItem('Task 1');
		ItemHeight[h] := 32;
		AddBar(h,'Task','1/2/2001','1/6/2001','K1',Null);
		ItemBar[h,'K1',EXGANTTLib_TLB.exBarCaption] := '<bgcolor=FF0000> to do </bgcolor>';
		ItemBar[h,'K1',EXGANTTLib_TLB.exBarVAlignCaption] := OleVariant(0);
	end;
end
|
|
497
|
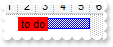
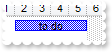
How can I align the HTML text or caption of the bar in the chart
with Gantt1 do
begin
	Columns.Add('Task');
	Chart.FirstVisibleDate := '1/1/2001';
	with Items do
	begin
		h := AddItem('Task 1');
		AddBar(h,'Task','1/2/2001','1/6/2001','K1',Null);
		ItemBar[h,'K1',EXGANTTLib_TLB.exBarCaption] := '<bgcolor=FF0000> to do </bgcolor>';
		ItemBar[h,'K1',EXGANTTLib_TLB.exBarHAlignCaption] := OleVariant(0);
	end;
end
|
|
496
|
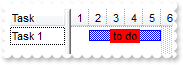
How can I assign a text or some HTML caption to a bar in the chart
with Gantt1 do
begin
	Columns.Add('Task');
	Chart.FirstVisibleDate := '1/1/2001';
	with Items do
	begin
		h := AddItem('Task 1');
		AddBar(h,'Task','1/2/2001','1/6/2001','K1',Null);
		ItemBar[h,'K1',EXGANTTLib_TLB.exBarCaption] := ' <bgcolor=FF0000>to do</bgcolor> ';
	end;
end
|
|
495
|
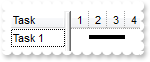
How can I change the ending date of the bar in the chart
with Gantt1 do
begin
	Columns.Add('Task');
	Chart.FirstVisibleDate := '1/1/2001';
	with Items do
	begin
		h := AddItem('Task 1');
		AddBar(h,'Task','1/2/2001','1/4/2001','K1',Null);
		ItemBar[h,'K1',EXGANTTLib_TLB.exBarEnd] := '1/6/2001';
	end;
end
|
|
494
|
How can I change the starting date of the bar in the chart
with Gantt1 do
begin
	Columns.Add('Task');
	Chart.FirstVisibleDate := '1/1/2001';
	with Items do
	begin
		h := AddItem('Task 1');
		AddBar(h,'Task','1/2/2001','1/4/2001','K1',Null);
		ItemBar[h,'K1',EXGANTTLib_TLB.exBarStart] := '1/1/2001';
	end;
end
|
|
493
|
How can I change the style or the name of the bar in the chart
with Gantt1 do
begin
	Columns.Add('Task');
	Chart.FirstVisibleDate := '1/1/2001';
	with Items do
	begin
		h := AddItem('Task 1');
		AddBar(h,'Task','1/2/2001','1/4/2001','K1',Null);
		ItemBar[h,'K1',EXGANTTLib_TLB.exBarName] := 'Progress';
	end;
end
|
|
492
|
How can I access properties and methods of the bar in the chart
with Gantt1 do
begin
	Columns.Add('Task');
	Chart.FirstVisibleDate := '1/1/2001';
	with Items do
	begin
		h := AddItem('Task 1');
		AddBar(h,'Task','1/2/2001','1/4/2001','K1',Null);
		ItemBar[h,'K1',EXGANTTLib_TLB.exBarName] := 'Progress';
	end;
end
|
|
491
|
How can I remove all bars in the item
with Gantt1 do
begin
	Columns.Add('Task');
	Chart.FirstVisibleDate := '1/1/2001';
	with Items do
	begin
		h := AddItem('Task 1');
		AddBar(h,'Task','1/2/2001','1/4/2001','K1',Null);
		ClearBars(h);
	end;
end
|
|
490
|
How can I remove a bar from the chart
with Gantt1 do
begin
	Columns.Add('Task');
	Chart.FirstVisibleDate := '1/1/2001';
	with Items do
	begin
		h := AddItem('Task 1');
		AddBar(h,'Task','1/2/2001','1/4/2001','K1',Null);
		RemoveBar(h,'K1');
	end;
end
|
|
489
|
How can I add a bar and some text inside, in the chart area
with Gantt1 do
begin
	Columns.Add('Task');
	Chart.FirstVisibleDate := '1/1/2001';
	with Items do
	begin
		AddBar(AddItem('Task 1'),'Task','1/2/2001','1/6/2001',Null,' to do ');
	end;
end
|
|
488
|
How can I add a bar and some text inside, in the chart area
with Gantt1 do
begin
	Columns.Add('Task');
	Chart.FirstVisibleDate := '1/1/2001';
	with Items do
	begin
		AddBar(AddItem('Task 1'),'Task','1/2/2001','1/6/2001',Null,'<bgcolor=FF0000> to do </bgcolor>');
	end;
end
|
|
487
|
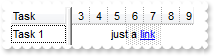
How can I add an anchor or a hyperline in the chart area
with Gantt1 do
begin
	Columns.Add('Task');
	Chart.FirstVisibleDate := '1/1/2001';
	with Items do
	begin
		AddBar(AddItem('Task 1'),'','1/2/2001','1/14/2001',Null,'just a <a1>link</a>');
	end;
end
|
|
486
|
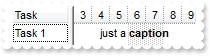
How can I add some text or captions in the chart area
with Gantt1 do
begin
	Columns.Add('Task');
	Chart.FirstVisibleDate := '1/1/2001';
	with Items do
	begin
		AddBar(AddItem('Task 1'),'','1/2/2001','1/14/2001',Null,'just a <b>caption</b>');
	end;
end
|
|
485
|
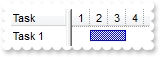
How can I add a bar in the chart area
with Gantt1 do
begin
	Columns.Add('Task');
	Chart.FirstVisibleDate := '1/1/2001';
	with Items do
	begin
		AddBar(AddItem('Task 1'),'Task','1/2/2001','1/4/2001',Null,Null);
	end;
end
|
|
484
|
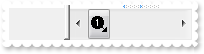
Is there any option to put a picture or an icon to the thumb part of the scroll bar
with Gantt1 do
begin
	Images('gBJJgBAIDAAGAAEAAQhYAf8Pf4hh0QihCJo2AEZjQAjEZFEaIEaEEaAIAkcbk0olUrlktl0vmExmUzmk1m03nE5nU7nk9n0/oFBoVDolFo1HpFJpVLplNp1PqFRqVTql' +
	'Vq1XrFZrVbrldr1fsFhsVjslls1ntFptVrtltt1vuFxuVzul1u13vF5vV7vl9v1/wGBwWDwmFw2HxGJxWLxmNx0xiFdyOTh8Tf9ZymXx+QytcyNgz8r0OblWjyWds+m0' +
	'ka1Vf1ta1+r1mos2xrG2xeZ0+a0W0qOx3GO4NV3WeyvD2XJ5XL5nN51aiw+lfSj0gkUkAEllHanHI5j/cHg8EZf7w8vl8j4f/qfEZeB09/vjLAB30+kZQAP/P5/H6/yN' +
	'AOAEAwCjMBwFAEDwJBMDwLBYAP2/8Hv8/gAGAD8LQs9w/nhDY/oygIA=');
	ScrollPartCaption[EXGANTTLib_TLB.exHChartScroll,EXGANTTLib_TLB.exThumbPart] := '<img>1</img>';
	ScrollThumbSize[EXGANTTLib_TLB.exHChartScroll] := 24;
end
|
|
483
|
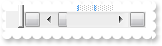
How can I scroll fast the chart, or page by page

with Gantt1 do
begin
	Images('gBJJgBAIDAAGAAEAAQhYAf8Pf4hh0QihCJo2AEZjQAjEZFEaIEaEEaAIAkcbk0olUrlktl0vmExmUzmk1m03nE5nU7nk9n0/oFBoVDolFo1HpFJpVLplNp1PqFRqVTql' +
	'Vq1XrFZrVbrldr1fsFhsVjslls1ntFptVrtltt1vuFxuVzul1u13vF5vV7vl9v1/wGBwWDwmFw2HxGJxWLxmNx0xiFdyOTh8Tf9ZymXx+QytcyNgz8r0OblWjyWds+m0' +
	'ka1Vf1ta1+r1mos2xrG2xeZ0+a0W0qOx3GO4NV3WeyvD2XJ5XL5nN51aiw+lfSj0gkUkAEllHanHI5j/cHg8EZf7w8vl8j4f/qfEZeB09/vjLAB30+kZQAP/P5/H6/yN' +
	'AOAEAwCjMBwFAEDwJBMDwLBYAP2/8Hv8/gAGAD8LQs9w/nhDY/oygIA=');
	ScrollHeight := 20;
	ScrollButtonWidth := 20;
	AllowChartScrollPage := True;
	ScrollPartCaption[EXGANTTLib_TLB.exHChartScroll,EXGANTTLib_TLB.exLeftB5Part] := '<img>1</img>';
	ScrollPartCaption[EXGANTTLib_TLB.exHChartScroll,EXGANTTLib_TLB.exRightB1Part] := '<img>2</img>';
end
|
|
482
|
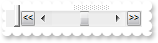
How can I scroll fast the chart, or page by page
with Gantt1 do
begin
	ScrollButtonWidth := 16;
	AllowChartScrollPage := True;
	ScrollPartCaption[EXGANTTLib_TLB.exHChartScroll,EXGANTTLib_TLB.exLeftB5Part] := '<<';
	ScrollPartCaption[EXGANTTLib_TLB.exHChartScroll,EXGANTTLib_TLB.exRightB1Part] := '>>';
end
|
|
481
|
How can I scroll fast the chart, or page by page
with Gantt1 do
begin
	AllowChartScrollPage := True;
end
|
|
480
|
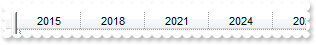
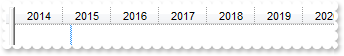
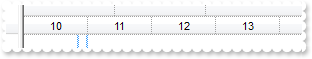
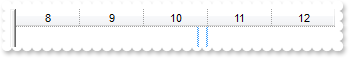
How can I display years, from 3 to 3
with Gantt1 do
begin
	Chart.UnitWidth := 64;
	with Chart.Level[0] do
	begin
		Label := '<%yyyy%>';
		Unit := EXGANTTLib_TLB.exYear;
		Count := 3;
	end;
end
|
|
479
|
How can I display years
with Gantt1 do
begin
	Chart.UnitWidth := 64;
	with Chart.Level[0] do
	begin
		Label := '<%yy%>';
		Unit := EXGANTTLib_TLB.exYear;
	end;
end
|
|
478
|
How can I display years
with Gantt1 do
begin
	Chart.UnitWidth := 48;
	Chart.Level[0].Label := OleVariant(0);
end
|
|
477
|
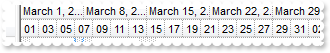
How can I display months, from 3 to 3
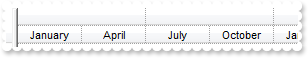
with Gantt1 do
begin
	Chart.FirstVisibleDate := '1/1/2001';
	Chart.LevelCount := 2;
	Chart.UnitWidth := 64;
	Chart.Level[0].Label := OleVariant(1);
	with Chart.Level[1] do
	begin
		Label := '<%mmmm%>';
		Unit := EXGANTTLib_TLB.exMonth;
		Count := 3;
	end;
end
|
|
476
|
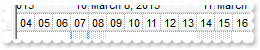
How can I display months
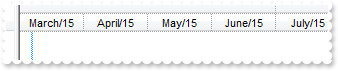
with Gantt1 do
begin
	Chart.UnitWidth := 64;
	Chart.LevelCount := 2;
	Chart.Level[0].Label := OleVariant(1);
	with Chart.Level[1] do
	begin
		Label := '<%mmmm%>/<%yy%>';
		Unit := EXGANTTLib_TLB.exMonth;
	end;
end
|
|
475
|
How can I display months
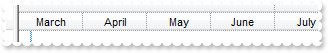
with Gantt1 do
begin
	Chart.LevelCount := 2;
	Chart.UnitWidth := 64;
	Chart.Level[0].Label := OleVariant(1);
	Chart.Level[1].Label := OleVariant(16);
end
|
|
474
|
How can I display weeks
with Gantt1 do
begin
	Chart.LevelCount := 2;
	Chart.UnitWidth := 64;
	Chart.Level[0].Label := OleVariant(17);
	Chart.Level[1].Label := OleVariant(256);
end
|
|
473
|
How can I display weeks
with Gantt1 do
begin
	Chart.LevelCount := 2;
	Chart.Level[0].Label := OleVariant(17);
	Chart.Level[1].Label := '<%ww%>';
end
|
|
472
|
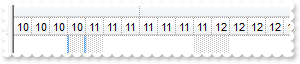
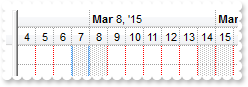
How can I display days, from 2 to 2
with Gantt1 do
begin
	Chart.LevelCount := 2;
	Chart.Level[0].Label := OleVariant(256);
	with Chart.Level[1] do
	begin
		Label := '<%dd%>';
		Count := 2;
	end;
end
|
|
471
|
How can I display days
with Gantt1 do
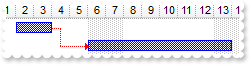
begin
Chart.LevelCount := 2;
Chart.Level[0].Label := OleVariant(256);
Chart.Level[1].Label := '<%dd%>';
end
|
|
470
|
How can I display days
with Gantt1 do
begin
	Chart.LevelCount := 2;
	Chart.Level[0].Label := OleVariant(256);
	Chart.Level[1].Label := OleVariant(4096);
end
|
|
469
|
How can I display hours, from 6 to 6
with Gantt1 do
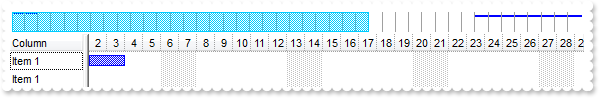
begin
Chart.FirstVisibleDate := '00:00';
Chart.LevelCount := 2;
Chart.Level[0].Label := OleVariant(4096);
with Chart.Level[1] do
begin
Label := '<%hh%>';
Count := 6;
end;
end
|
|
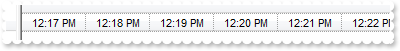
468
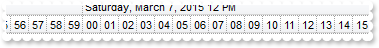
|
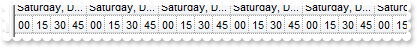
How can I display hours
with Gantt1 do
begin
	Chart.LevelCount := 2;
	Chart.Level[0].Label := OleVariant(4096);
	Chart.Level[1].Label := '<%hh%>';
end
|
|
467
|
How can I display hours
with Gantt1 do
begin
	Chart.LevelCount := 2;
	Chart.Level[0].Label := OleVariant(4096);
	Chart.Level[1].Label := OleVariant(65536);
end
|
|
466
|
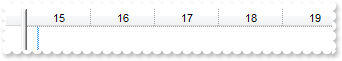
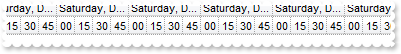
How can I display minutes, from 15 to 15
with Gantt1 do
begin
	Chart.FirstVisibleDate := '00:00';
	Chart.LevelCount := 2;
	Chart.Level[0].Label := OleVariant(65536);
	with Chart.Level[1] do
	begin
		Label := '<%nn%>';
		Count := 15;
	end;
end
|
|
465
|
How can I display minutes
with Gantt1 do
begin
	Chart.LevelCount := 2;
	Chart.Level[0].Label := OleVariant(65536);
	Chart.Level[1].Label := '<%nn%>';
end
|
|
464
|
How can I display minutes
with Gantt1 do
begin
	Chart.LevelCount := 2;
	Chart.UnitWidth := 64;
	Chart.Level[0].Label := OleVariant(65536);
	Chart.Level[1].Label := OleVariant(1048576);
end
|
|
463
|
How can I display seconds, from 15 to 15
with Gantt1 do
begin
	Chart.FirstVisibleDate := '00:00';
	Chart.LevelCount := 2;
	Chart.Level[0].Label := OleVariant(1048576);
	with Chart.Level[1] do
	begin
		Label := '<%ss%>';
		Count := 15;
	end;
end
|
|
462
|
How can I display seconds
with Gantt1 do
begin
	Chart.LevelCount := 2;
	Chart.Level[0].Label := OleVariant(1048576);
	Chart.Level[1].Label := '<%ss%>';
end
|
|
461
|
How can I display seconds
with Gantt1 do
begin
	Chart.LevelCount := 2;
	Chart.Level[0].Label := OleVariant(1048576);
	Chart.Level[1].Label := OleVariant(16777216);
end
|
|
460
|
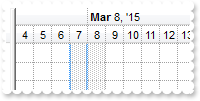
How can I align the text being shown in the chart's header
with Gantt1 do
begin
	Chart.UnitWidth := 64;
	with Chart.Level[0] do
	begin
		Label := '<b><%mmmm%></b> <r><%m%>';
		Unit := EXGANTTLib_TLB.exMonth;
		Alignment := EXGANTTLib_TLB.LeftAlignment;
	end;
end
|
|
459
|
How can I hide the tooltip being displayed in the chart's header
with Gantt1 do
begin
	Chart.Level[0].ToolTip := '';
end
|
|
458
|
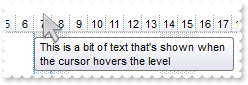
How can I change the tooltip being displayed in the chart's header
with Gantt1 do
begin
	Chart.Level[0].ToolTip := 'This is a bit of text that''s shown when the cursor hovers the level';
end
|
|
457
|
How can I change the visual appearance of the chart's header, where levels are displayed, using your EBN files
with Gantt1 do
begin
	VisualAppearance.Add(1,'c:\exontrol\images\normal.ebn');
	Chart.LevelCount := 2;
	Chart.BackColorLevelHeader := $1000000;
end
|
|
456
|
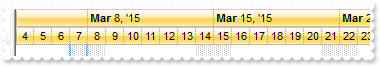
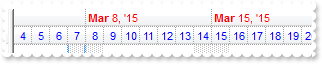
How can I change the level's foreground color in the chart
with Gantt1 do
begin
	Chart.LevelCount := 2;
	Chart.Level[0].ForeColor := $ff;
	Chart.Level[1].ForeColor := $ff0000;
end
|
|
455
|
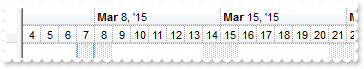
How can I change the level's background color in the chart
with Gantt1 do
begin
	Chart.LevelCount := 2;
	Chart.Level[0].BackColor := $ff;
end
|
|
452
|
How can I add icons or pictures to the scale or zoom area
with Gantt1 do
begin
HTMLPicture['pic1'] := 'c:\exontrol\images\zipdisk.gif';
Images('gBJJgBAIDAAGAAEAAQhYAf8Pf4hh0QihCJo2AEZjQAjEZFEaIEaEEaAIAkcbk0olUrlktl0vmExmUzmk1m03nE5nU7nk9n0/oFBoVDolFo1HpFJpVLplNp1PqFRqVTql' +
'Vq1XrFZrVbrldr1fsFhsVjslls1ntFptVrtltt1vuFxuVzul1u13vF5vV7vl9v1/wGBwWDwmFw2HxGJxWLxmNx0xiFdyOTh8Tf9ZymXx+QytcyNgz8r0OblWjyWds+m0' +
'ka1Vf1ta1+r1mos2xrG2xeZ0+a0W0qOx3GO4NV3WeyvD2XJ5XL5nN51aiw+lfSj0gkUkAEllHanHI5j/cHg8EZf7w8vl8j4f/qfEZeB09/vjLAB30+kZQAP/P5/H6/yN' +
'AOAEAwCjMBwFAEDwJBMDwLBYAP2/8Hv8/gAGAD8LQs9w/nhDY/oygIA=');
with Chart do
begin
OverviewHeight := 48;
OverviewVisible := EXGANTTLib_TLB.exOverviewShowAll;
AllowOverviewZoom := EXGANTTLib_TLB.exZoomOnRClick;
OverviewZoomCaption := 'Year|�Year|�Year|<img>3</img> Week|Third|<img>2</img> Day|<img>pic1</img>|Hour|Min|Sec';
Label[EXGANTTLib_TLB.exYear] := '';
Label[EXGANTTLib_TLB.exHalfYear] := '';
Label[EXGANTTLib_TLB.exQuarterYear] := '';
Label[EXGANTTLib_TLB.exThirdMonth] := '';
Label[EXGANTTLib_TLB.exHour] := '';
Label[EXGANTTLib_TLB.exMinute] := '';
Label[EXGANTTLib_TLB.exSecond] := '';
OverviewZoomUnit := 52;
end;
Columns.Add('');
with Items do
begin
CellSingleLine[OleVariant(AddItem('Right click the Overview area and select a new scale')),OleVariant(0)] := EXGANTTLib_TLB.exCaptionWordWrap;
end;
end
|
|
451
|
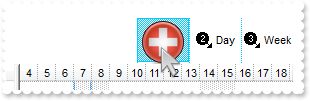
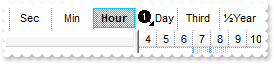
How can I add icons or pictures to the scale or zoom area
with Gantt1 do
begin
HTMLPicture['pic1'] := 'c:\exontrol\images\zipdisk.gif';
Images('gBJJgBAIDAAGAAEAAQhYAf8Pf4hh0QihCJo2AEZjQAjEZFEaIEaEEaAIAkcbk0olUrlktl0vmExmUzmk1m03nE5nU7nk9n0/oFBoVDolFo1HpFJpVLplNp1PqFRqVTql' +
'Vq1XrFZrVbrldr1fsFhsVjslls1ntFptVrtltt1vuFxuVzul1u13vF5vV7vl9v1/wGBwWDwmFw2HxGJxWLxmNx0xiFdyOTh8Tf9ZymXx+QytcyNgz8r0OblWjyWds+m0' +
'ka1Vf1ta1+r1mos2xrG2xeZ0+a0W0qOx3GO4NV3WeyvD2XJ5XL5nN51aiw+lfSj0gkUkAEllHanHI5j/cHg8EZf7w8vl8j4f/qfEZeB09/vjLAB30+kZQAP/P5/H6/yN' +
'AOAEAwCjMBwFAEDwJBMDwLBYAP2/8Hv8/gAGAD8LQs9w/nhDY/oygIA=');
with Chart do
begin
OverviewHeight := 48;
OverviewVisible := EXGANTTLib_TLB.exOverviewShowAll;
AllowOverviewZoom := EXGANTTLib_TLB.exAlwaysZoom;
OverviewZoomCaption := 'Year|�Year|�Year|<img>3</img> Week|Third|<img>2</img> Day|<img>pic1</img>|Hour|Min|Sec';
Label[EXGANTTLib_TLB.exYear] := '';
Label[EXGANTTLib_TLB.exHalfYear] := '';
Label[EXGANTTLib_TLB.exQuarterYear] := '';
Label[EXGANTTLib_TLB.exThirdMonth] := '';
Label[EXGANTTLib_TLB.exHour] := '';
Label[EXGANTTLib_TLB.exMinute] := '';
Label[EXGANTTLib_TLB.exSecond] := '';
OverviewZoomUnit := 52;
end;
end
|
|
450
|
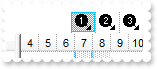
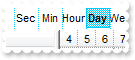
How can I change the width of the unit in the scale or zoom
with Gantt1 do
begin
Images('gBJJgBAIDAAGAAEAAQhYAf8Pf4hh0QihCJo2AEZjQAjEZFEaIEaEEaAIAkcbk0olUrlktl0vmExmUzmk1m03nE5nU7nk9n0/oFBoVDolFo1HpFJpVLplNp1PqFRqVTql' +
'Vq1XrFZrVbrldr1fsFhsVjslls1ntFptVrtltt1vuFxuVzul1u13vF5vV7vl9v1/wGBwWDwmFw2HxGJxWLxmNx0xiFdyOTh8Tf9ZymXx+QytcyNgz8r0OblWjyWds+m0' +
'ka1Vf1ta1+r1mos2xrG2xeZ0+a0W0qOx3GO4NV3WeyvD2XJ5XL5nN51aiw+lfSj0gkUkAEllHanHI5j/cHg8EZf7w8vl8j4f/qfEZeB09/vjLAB30+kZQAP/P5/H6/yN' +
'AOAEAwCjMBwFAEDwJBMDwLBYAP2/8Hv8/gAGAD8LQs9w/nhDY/oygIA=');
with Chart do
begin
OverviewVisible := EXGANTTLib_TLB.exOverviewShowAll;
AllowOverviewZoom := EXGANTTLib_TLB.exAlwaysZoom;
OverviewZoomCaption := 'Year|�Year|�Year|<img>3</img>|Third|<img>2</img>|<img>1</img>|Hour|Min|Sec';
Label[EXGANTTLib_TLB.exYear] := '';
Label[EXGANTTLib_TLB.exHalfYear] := '';
Label[EXGANTTLib_TLB.exQuarterYear] := '';
Label[EXGANTTLib_TLB.exThirdMonth] := '';
Label[EXGANTTLib_TLB.exHour] := '';
Label[EXGANTTLib_TLB.exMinute] := '';
Label[EXGANTTLib_TLB.exSecond] := '';
OverviewZoomUnit := 24;
end;
end
|
|
449
|
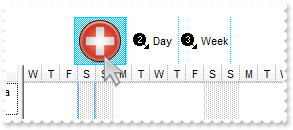
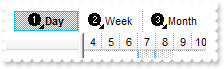
How can I a scale or zoom of the chart, when right clicking the chart's header
with Gantt1 do
begin
Images('gBJJgBAIDAAGAAEAAQhYAf8Pf4hh0QihCJo2AEZjQAjEZFEaIEaEEaAIAkcbk0olUrlktl0vmExmUzmk1m03nE5nU7nk9n0/oFBoVDolFo1HpFJpVLplNp1PqFRqVTql' +
'Vq1XrFZrVbrldr1fsFhsVjslls1ntFptVrtltt1vuFxuVzul1u13vF5vV7vl9v1/wGBwWDwmFw2HxGJxWLxmNx0xiFdyOTh8Tf9ZymXx+QytcyNgz8r0OblWjyWds+m0' +
'ka1Vf1ta1+r1mos2xrG2xeZ0+a0W0qOx3GO4NV3WeyvD2XJ5XL5nN51aiw+lfSj0gkUkAEllHanHI5j/cHg8EZf7w8vl8j4f/qfEZeB09/vjLAB30+kZQAP/P5/H6/yN' +
'AOAEAwCjMBwFAEDwJBMDwLBYAP2/8Hv8/gAGAD8LQs9w/nhDY/oygIA=');
with Chart do
begin
OverviewVisible := EXGANTTLib_TLB.exOverviewShowAll;
AllowOverviewZoom := EXGANTTLib_TLB.exZoomOnRClick;
OverviewZoomCaption := 'Year|�Year|�Year|<img>3</img>Month|Third|<img>2</img>Week|<img>1</img>Day|Hour|Min|Sec';
Label[EXGANTTLib_TLB.exYear] := '';
Label[EXGANTTLib_TLB.exHalfYear] := '';
Label[EXGANTTLib_TLB.exQuarterYear] := '';
Label[EXGANTTLib_TLB.exThirdMonth] := '';
Label[EXGANTTLib_TLB.exHour] := '';
Label[EXGANTTLib_TLB.exMinute] := '';
Label[EXGANTTLib_TLB.exSecond] := '';
OverviewZoomUnit := 64;
end;
Columns.Add('');
with Items do
begin
CellSingleLine[OleVariant(AddItem('Right click the Overview area and select a new scale')),OleVariant(0)] := EXGANTTLib_TLB.exCaptionWordWrap;
end;
end
|
|
448
|
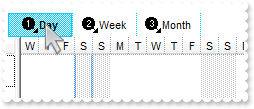
How can I a customize the scale or zoom of the chart
with Gantt1 do
begin
Images('gBJJgBAIDAAGAAEAAQhYAf8Pf4hh0QihCJo2AEZjQAjEZFEaIEaEEaAIAkcbk0olUrlktl0vmExmUzmk1m03nE5nU7nk9n0/oFBoVDolFo1HpFJpVLplNp1PqFRqVTql' +
'Vq1XrFZrVbrldr1fsFhsVjslls1ntFptVrtltt1vuFxuVzul1u13vF5vV7vl9v1/wGBwWDwmFw2HxGJxWLxmNx0xiFdyOTh8Tf9ZymXx+QytcyNgz8r0OblWjyWds+m0' +
'ka1Vf1ta1+r1mos2xrG2xeZ0+a0W0qOx3GO4NV3WeyvD2XJ5XL5nN51aiw+lfSj0gkUkAEllHanHI5j/cHg8EZf7w8vl8j4f/qfEZeB09/vjLAB30+kZQAP/P5/H6/yN' +
'AOAEAwCjMBwFAEDwJBMDwLBYAP2/8Hv8/gAGAD8LQs9w/nhDY/oygIA=');
with Chart do
begin
OverviewVisible := EXGANTTLib_TLB.exOverviewShowAll;
AllowOverviewZoom := EXGANTTLib_TLB.exAlwaysZoom;
OverviewZoomCaption := 'Year|�Year|�Year|<img>3</img>Month|Third|<img>2</img>Week|<img>1</img>Day|Hour|Min|Sec';
Label[EXGANTTLib_TLB.exYear] := '';
Label[EXGANTTLib_TLB.exHalfYear] := '';
Label[EXGANTTLib_TLB.exQuarterYear] := '';
Label[EXGANTTLib_TLB.exThirdMonth] := '';
Label[EXGANTTLib_TLB.exHour] := '';
Label[EXGANTTLib_TLB.exMinute] := '';
Label[EXGANTTLib_TLB.exSecond] := '';
OverviewZoomUnit := 64;
end;
end
|
|
447
|
How can I a scale or zoom the chart at runtime
with Gantt1 do
begin
Images('gBJJgBAIDAAGAAEAAQhYAf8Pf4hh0QihCJo2AEZjQAjEZFEaIEaEEaAIAkcbk0olUrlktl0vmExmUzmk1m03nE5nU7nk9n0/oFBoVDolFo1HpFJpVLplNp1PqFRqVTql' +
'Vq1XrFZrVbrldr1fsFhsVjslls1ntFptVrtltt1vuFxuVzul1u13vF5vV7vl9v1/wGBwWDwmFw2HxGJxWLxmNx0xiFdyOTh8Tf9ZymXx+QytcyNgz8r0OblWjyWds+m0' +
'ka1Vf1ta1+r1mos2xrG2xeZ0+a0W0qOx3GO4NV3WeyvD2XJ5XL5nN51aiw+lfSj0gkUkAEllHanHI5j/cHg8EZf7w8vl8j4f/qfEZeB09/vjLAB30+kZQAP/P5/H6/yN' +
'AOAEAwCjMBwFAEDwJBMDwLBYAP2/8Hv8/gAGAD8LQs9w/nhDY/oygIA=');
with Chart do
begin
OverviewVisible := EXGANTTLib_TLB.exOverviewShowAll;
AllowOverviewZoom := EXGANTTLib_TLB.exAlwaysZoom;
OverviewZoomCaption := '�Year|�Year|<img>3</img>Month|Third|<img>2</img>Week|<img>1</img>Day|Hour|Min|Sec';
end;
end
|
|
446
|
How can I a scale or zoom the chart at runtime
with Gantt1 do
begin
	with Chart do
	begin
		OverviewVisible := EXGANTTLib_TLB.exOverviewShowAll;
		AllowOverviewZoom := EXGANTTLib_TLB.exAlwaysZoom;
		OverviewZoomUnit := 24;
	end;
end
|
|
445
|
How can I a programmatically select a date
with Gantt1 do
begin
	Chart.MarkSelectDateColor := $ff;
	Chart.FirstVisibleDate := '1/1/2001';
	Chart.SelectDate['1/2/2001'] := True;
	Chart.SelectDate['1/5/2001'] := True;
	Chart.SelectLevel := 0;
end
|
|
444
|
How can I change the color to select a date, when clicking the chart's header
with Gantt1 do
begin
	Chart.BackColor := $ffffff;
	Chart.MarkSelectDateColor := $ff;
end
|
|
443
|
How can I enable or disable selecting a date, when clicking the chart's header
with Gantt1 do
begin
	Chart.BackColor := $ffffff;
	Chart.MarkSelectDateColor := $ffffff;
end
|
|
442
|
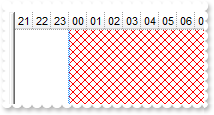
How can I specify the color or the stype for non working hours
with Gantt1 do
begin
	Chart.UnitScale := EXGANTTLib_TLB.exHour;
	Chart.PaneWidth[False] := 0;
	Chart.NonworkingHours := 127;
	Chart.NonworkingHoursPattern := EXGANTTLib_TLB.exPatternYard;
	Chart.NonworkingHoursColor := $ff;
end
|
|
441
|
How can I specify the pattern or the stype for non working hours
with Gantt1 do
begin
	Chart.UnitScale := EXGANTTLib_TLB.exHour;
	Chart.PaneWidth[False] := 0;
	Chart.NonworkingHours := 127;
	Chart.NonworkingHoursPattern := EXGANTTLib_TLB.exPatternDiagCross;
end
|
|
440
|
How can I specify the non working hours
with Gantt1 do
begin
	Chart.UnitScale := EXGANTTLib_TLB.exHour;
	Chart.PaneWidth[False] := 0;
	Chart.NonworkingHours := 127;
end
|
|
439
|
How can I get the index of the level from the point or cursor
with Gantt1 do
begin
	var_LevelFromPoint := Chart.LevelFromPoint[0,0];
end
|
|
438
|
How can I get the link from the point or cursor
with Gantt1 do
begin
	var_LinkFromPoint := Chart.LinkFromPoint[0,0];
end
|
|
437
|
How can I check or verify if a date is a non working day
with Gantt1 do
begin
	Chart.FirstVisibleDate := '1/1/2001';
	Columns.Add(Gantt1.Chart.IsNonworkingDate['1/1/2001']);
end
|
|
436
|
How can I check or verify if a date fits the chart's visible area
with Gantt1 do
begin
	Chart.FirstVisibleDate := '1/1/2001';
	Columns.Add(Gantt1.Chart.IsDateVisible['1/1/2001']);
end
|
|
435
|
How can I add a remove all non working days
with Gantt1 do
begin
	Chart.NonworkingDays := 0;
	Chart.FirstVisibleDate := '1/1/2001';
	Chart.AddNonworkingDate('1/1/2001');
	Chart.ClearNonworkingDates();
end
|
|
434
|
How can I add a remove a non working days
with Gantt1 do
begin
	Chart.NonworkingDays := 0;
	Chart.FirstVisibleDate := '1/1/2001';
	Chart.AddNonworkingDate('1/1/2001');
	Chart.RemoveNonworkingDate('1/1/2001');
end
|
|
433
|
How can I add a custom non working days
with Gantt1 do
begin
	Chart.NonworkingDays := 0;
	Chart.FirstVisibleDate := '1/1/2001';
	Chart.AddNonworkingDate('1/1/2001');
	Chart.AddNonworkingDate('1/5/2001');
end
|
|
432
|
How can hide the non working days
with Gantt1 do
begin
	Chart.ShowNonworkingDates := False;
end
|
|
431
|
How can hide the non working days
with Gantt1 do
begin
	Chart.NonworkingDays := 0;
end
|
|
430
|
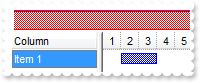
How can I change the width of the links between bars
with Gantt1 do
begin
	Chart.LinksStyle := EXGANTTLib_TLB.exLinkSolid;
	Chart.LinksWidth := 2;
	Chart.FirstVisibleDate := '1/1/2001';
	Columns.Add('Column');
	with Items do
	begin
		AddBar(AddItem('Item 1'),'Task','1/2/2001','1/4/2001','B1',Null);
		AddBar(AddItem('Item 2'),'Task','1/6/2001','1/14/2001','B2',Null);
		AddLink('L1',FindItem['Item 1',OleVariant(0),Null],'B1',FindItem['Item 2',OleVariant(0),Null],'B2');
	end;
end
|
|
429
|
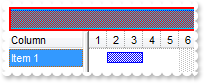
How can I change the style for the links between bars
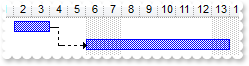
with Gantt1 do
begin
	Chart.LinksStyle := EXGANTTLib_TLB.exLinkDashDotDot;
	Chart.FirstVisibleDate := '1/1/2001';
	Columns.Add('Column');
	with Items do
	begin
		AddBar(AddItem('Item 1'),'Task','1/2/2001','1/4/2001','B1',Null);
		AddBar(AddItem('Item 2'),'Task','1/6/2001','1/14/2001','B2',Null);
		AddLink('L1',FindItem['Item 1',OleVariant(0),Null],'B1',FindItem['Item 2',OleVariant(0),Null],'B2');
	end;
end
|
|
428
|
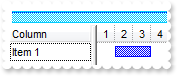
How can I change the color for the links between bars
with Gantt1 do
begin
	Chart.LinksColor := $ff;
	Chart.FirstVisibleDate := '1/1/2001';
	Columns.Add('Column');
	with Items do
	begin
		AddBar(AddItem('Item 1'),'Task','1/2/2001','1/4/2001','B1',Null);
		AddBar(AddItem('Item 2'),'Task','1/6/2001','1/14/2001','B2',Null);
		AddLink('L1',FindItem['Item 1',OleVariant(0),Null],'B1',FindItem['Item 2',OleVariant(0),Null],'B2');
	end;
end
|
|
427
|
How can I hide the links between bars
with Gantt1 do
begin
	Chart.FirstVisibleDate := '1/1/2001';
	Columns.Add('Column');
	with Items do
	begin
		AddBar(AddItem('Item 1'),'Task','1/2/2001','1/4/2001','B1',Null);
		AddBar(AddItem('Item 2'),'Task','1/6/2001','1/14/2001','B2',Null);
		AddLink('L1',FindItem['Item 1',OleVariant(0),Null],'B1',FindItem['Item 2',OleVariant(0),Null],'B2');
	end;
	Chart.ShowLinks := False;
end
|
|
426
|
How can I display some grid line in the overview area
with Gantt1 do
begin
	Chart.OverviewVisible := EXGANTTLib_TLB.exOverviewShowAll;
	Chart.OverviewLevelLines := 0;
	Chart.FirstVisibleDate := '1/1/2001';
	Columns.Add('Column');
	with Items do
	begin
		AddBar(AddItem('Item 1'),'Task','1/2/2001','1/4/2001',Null,Null);
		AddBar(AddItem('Item 1'),'Task','1/6/2001','1/14/2001',Null,Null);
	end;
end
|
|
425
|
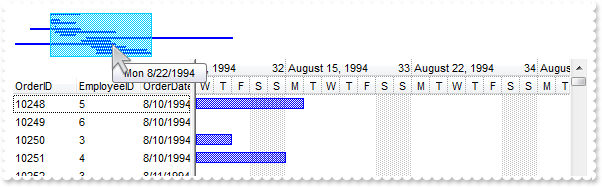
How do I change the tooltip when the cursor hovers the overview area
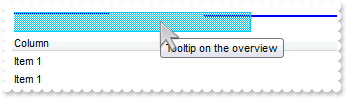
with Gantt1 do
begin
	Chart.OverviewVisible := EXGANTTLib_TLB.exOverviewShowAll;
	Chart.OverviewToolTip := 'Tooltip on the overview';
	Chart.FirstVisibleDate := '1/1/2001';
	Columns.Add('Column');
	with Items do
	begin
		AddBar(AddItem('Item 1'),'Task','1/2/2001','1/4/2001',Null,Null);
		AddBar(AddItem('Item 1'),'Task','1/6/2001','1/14/2001',Null,Null);
	end;
end
|
|
424
|
How do I remove the tooltip when the cursor hovers the overview area
with Gantt1 do
begin
	Chart.OverviewVisible := EXGANTTLib_TLB.exOverviewShowAll;
	Chart.OverviewToolTip := '';
	Chart.FirstVisibleDate := '1/1/2001';
	Columns.Add('Column');
	with Items do
	begin
		AddBar(AddItem('Item 1'),'Task','1/2/2001','1/4/2001',Null,Null);
	end;
end
|
|
423
|
How do I change the selection color in the overview area
with Gantt1 do
begin
	Chart.OverviewVisible := EXGANTTLib_TLB.exOverviewShowAll;
	Chart.OverviewSelBackColor := $ff;
	Chart.FirstVisibleDate := '1/1/2001';
	Columns.Add('Column');
	with Items do
	begin
		AddBar(AddItem('Item 1'),'Task','1/2/2001','1/4/2001',Null,Null);
	end;
end
|
|
422
|
How do I change the background color for the overview area
with Gantt1 do
begin
	Chart.OverviewVisible := EXGANTTLib_TLB.exOverviewShowAll;
	Chart.OverviewBackColor := $ff;
	Chart.FirstVisibleDate := '1/1/2001';
	Columns.Add('Column');
	with Items do
	begin
		AddBar(AddItem('Item 1'),'Task','1/2/2001','1/4/2001',Null,Null);
	end;
end
|
|
421
|
How do I specify the height for the overview area
with Gantt1 do
begin
	Chart.OverviewVisible := EXGANTTLib_TLB.exOverviewShowAll;
	Chart.OverviewHeight := 16;
	Chart.FirstVisibleDate := '1/1/2001';
	Columns.Add('Column');
	with Items do
	begin
		AddBar(AddItem('Item 1'),'Task','1/2/2001','1/4/2001',Null,Null);
	end;
end
|
|
420
|
How do I show or hide the control's overview area
with Gantt1 do
begin
	Chart.OverviewVisible := EXGANTTLib_TLB.exOverviewShowAll;
	Chart.FirstVisibleDate := '1/1/2001';
	Columns.Add('Column');
	with Items do
	begin
		AddBar(AddItem('Item 1'),'Task','1/2/2001','1/4/2001',Null,Null);
	end;
end
|
|
419
|
How do I get the bar from the point or cursor
with Gantt1 do
begin
	var_BarFromPoint := Chart.BarFromPoint[0,0];
end
|
|
418
|
How do I specify the color of pattern for non working days
with Gantt1 do
begin
	Chart.NonworkingDays := 66;
	Chart.NonworkingDaysPattern := EXGANTTLib_TLB.exPatternVertical;
	Chart.NonworkingDaysColor := $ff;
end
|
|
417
|
How do I specify the type of pattern for non working days
with Gantt1 do
begin
	Chart.NonworkingDays := 66;
	Chart.NonworkingDaysPattern := EXGANTTLib_TLB.exPatternBrick;
end
|
|
416
|
How do I specify the non working days
with Gantt1 do
begin
	Chart.NonworkingDays := 66;
end
|
|
415
|
How do I specify the non working days
with Gantt1 do
begin
	Chart.NonworkingDays := 66;
end
|
|
414
|
How do I add a predefined bar
with Gantt1 do
begin
	Chart.Bars.Add('CustomBar').Color := $ff;
	Chart.FirstVisibleDate := '1/1/2001';
	Columns.Add('Column');
	with Items do
	begin
		AddBar(AddItem('Item 1'),'CustomBar','1/2/2001','1/4/2001',Null,Null);
	end;
end
|
|
413
|
How do I change the unit being displayed in the chart
with Gantt1 do
begin
	Chart.PaneWidth[False] := 0;
	Chart.UnitScale := EXGANTTLib_TLB.exWeek;
	Chart.UnitWidth := 64;
end
|
|
412
|
How do I specify the prodefined tooltip being shown on the chart's header, when Zoom method is used
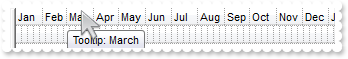
with Gantt1 do
begin
	Chart.PaneWidth[False] := 0;
	Chart.LevelCount := 2;
	Chart.Label[EXGANTTLib_TLB.exHalfYear] := '';
	Chart.Label[EXGANTTLib_TLB.exQuarterYear] := '';
	Chart.Label[EXGANTTLib_TLB.exMonth] := '<%m3%>';
	Chart.LabelToolTip[EXGANTTLib_TLB.exMonth] := 'Tooltip: <%mmmm%>';
	Chart.Zoom('1/1/2007','1/1/2008',Null);
	Chart.FirstVisibleDate := '1/1/2007';
end
|
|
411
|
How do I specify the prodefined labels being displayed on the chart, when Zoom method is used
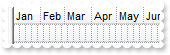
with Gantt1 do
begin
	Chart.PaneWidth[False] := 0;
	Chart.LevelCount := 2;
	Chart.Label[EXGANTTLib_TLB.exHalfYear] := '';
	Chart.Label[EXGANTTLib_TLB.exQuarterYear] := '';
	Chart.Label[EXGANTTLib_TLB.exMonth] := '<%m3%>';
	Chart.Zoom('1/1/2007','1/1/2008',Null);
	Chart.FirstVisibleDate := '1/1/2007';
end
|
|
410
|
How do I scale or zoom the chart to a specified range of date
with Gantt1 do
begin
	Chart.PaneWidth[False] := 0;
	Chart.LevelCount := 2;
	Chart.Label[EXGANTTLib_TLB.exHalfYear] := '';
	Chart.Label[EXGANTTLib_TLB.exQuarterYear] := '';
	Chart.Label[EXGANTTLib_TLB.exMonth] := '<%m3%>';
	Chart.Zoom('1/1/2007','1/1/2008',Null);
	Chart.FirstVisibleDate := '1/1/2007';
end
|
|
409
|
How do I scale or zoom the chart to a specified range of date
with Gantt1 do
begin
	Chart.PaneWidth[False] := 0;
	Chart.LevelCount := 2;
	Chart.Zoom('1/1/2007','7/1/2007',Null);
	Chart.FirstVisibleDate := '1/1/2007';
end
|
|
408
|
How do I find the next date or previous date
with Gantt1 do
begin
	with Chart do
	begin
		FirstVisibleDate := OleVariant(NextDate['1/1/2002',EXGANTTLib_TLB.exDay,OleVariant(1)]);
	end;
end
|
|
407
|
How can I change the color for the grid lines in the chart
with Gantt1 do
begin
	Chart.DrawGridLines := EXGANTTLib_TLB.exAllLines;
	Chart.LevelCount := 2;
	with Chart.Level[1] do
	begin
		DrawGridLines := True;
		GridLineColor := $ff;
	end;
end
|
|
406
|
How can I draw, show or hide the grid lines in the chart
with Gantt1 do
begin
	Chart.DrawGridLines := EXGANTTLib_TLB.exAllLines;
	Chart.LevelCount := 2;
	Chart.Level[1].DrawGridLines := True;
end
|
|
405
|
How do I change the color to highlight the today in the chart
with Gantt1 do
begin
	Chart.MarkTodayColor := $ff;
end
|
|
404
|
How do I hide or stop highlighting the today area in the chart
with Gantt1 do
begin
	Chart.BackColor := $ffffff;
	Chart.MarkTodayColor := $ffffff;
end
|
|
403
|
Is there any function to get the date in the format that I use for levels, to layout my chart's header
with Gantt1 do
begin
	h := Chart.FormatDate['1/1/2002','<%yyyy%> <%mmmm%> <%d%> <%dddd%>'];
	Columns.Add(h);
end
|
|
402
|
How can I get the date from the point, cursor
// MouseMove event - Occurs when the user moves the mouse.
procedure TForm1.Gantt1MouseMove(ASender: TObject; Button : Smallint; Shift : Smallint; X : Integer; Y : Integer);
begin
	with Gantt1 do
	begin
		OutputDebugString( Chart.DateFromPoint[-1,-1] );
	end
end;
|
|
401
|
How can I show or hide the small ticker that shows up when the cursor hovers the chart area
with Gantt1 do
begin
	Chart.DrawDateTicker := False;
end
|